First off: a spreadsheet that sent Europe into austerity
In 2010 the Harvard economists Carmen Reinhart and Kenneth Rogoff published an analysis of two centuries of public debt and economic growth Reinhart & Rogoff (2010). Their finding: as soon as a country’s debt exceeds 90% of its economic output, the economy shrinks by an average of 0.1% per year. The number went places. It appeared in the US Congress budget proposal, the EU monetary affairs commissioner quoted it, and it served as an argument for austerity in Europe after the financial crisis.
Three years later Thomas Herndon, a doctoral student at Amherst, was given a seminar assignment: recompute the numbers of a well-known study. He asked for the spreadsheet and found a selected cell range that was five rows short. Australia, Austria, Belgium, Canada and Denmark were missing from the average – all of them countries with high debt and respectable growth. On top of that came omitted years and an unusual weighting. With all three corrected, growth turned into Herndon et al. (2014). The cliff at 90% did not exist.
Everything this course is about is in that story. The raw numbers were real and public; the analysis was a handful of averages; and the result was still wrong, because nobody had checked which rows actually went into the calculation, and because a spreadsheet does not show you that. Finding the error took no better mathematics, just somebody willing to pick the data up again from the start. That is exactly what we practise: loading data instead of clicking on it; checking every summary figure against the rows it is made of; and writing calculations down so that others can repeat them. It is why we work with Python and not with Excel in this course, and why the chapter Data cleaning insists on logging every change made to the data.
What is “data”?
Gerhard Goos, Vorlesungen über Informatik, volume 1:
The representation of a communication by the variation of a physical quantity over time is called a signal. If, in representing and passing on a communication, we abstract away from the medium used and from the details of the signals and their parameters, the communication is called a message.
The knowledge needed to assign meaning to a message we call a context, or a frame of reference. The meaning assigned is called information. The pair <message, assigned information> is called a datum. The plural is data.
So we may call a CSV file “data” exactly when we have a context for giving meaning to the bit strings in it. Most of that context never registers consciously – we assume, for instance, that a CSV file opens in a text editor and that its contents are encoded as strings from which we could guess the data types just by looking. How each field of a table is encoded, though, is often something the table itself does not tell you; for that you need metadata.
Take the answers to a single-choice question: what the message usually records is the number of the chosen answer, not the string of the answer itself. That string is written down in a code book, a coding table, and to make sense of the answers as data we have to go back to it.
A colourful mix
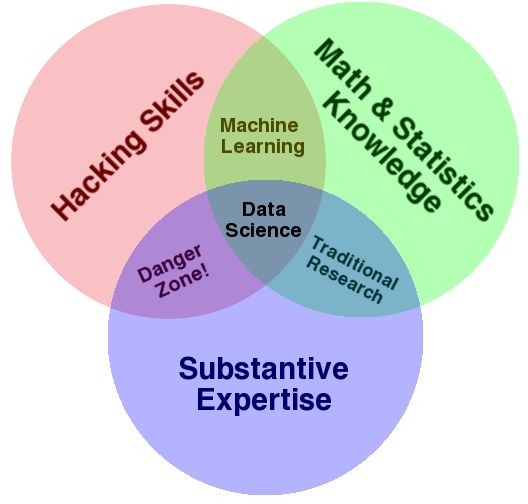
Figure 1:The “Data Science Venn Diagram” by Drew Conway (2013), CC BY-NC 3.0, source: drewconway
In 2013 Drew Conway gave what is still the most-quoted answer to the question of what data science consists of: the intersection of three circles. Hacking skills means being able to handle data in arbitrary formats by programming, math & statistics knowledge means knowing what a calculation on that data actually says, and substantive expertise is domain knowledge about the field the data comes from. Any two of the circles give you something familiar: hacking and statistics together are machine learning, statistics and domain knowledge are traditional research as the empirical sciences have long practised it. Hacking and domain knowledge without statistics is what Conway calls the danger zone: someone who can read data in, turn a method loose on it and find the results plausible for their field will believe them, without being able to judge whether they are anything more than chance. The spreadsheet at the start of this chapter shows that this zone is dangerous for experts too. This course supplies the statistics circle and practises the hacking circle on small datasets; the domain knowledge you will bring yourself, later, from whatever field you end up working in.
What is a data scientist?
Nearly all [...] working data scientists make their daily bread and butter through data collection and data cleaning; building dashboards and reports; data visualization; statistical inference; communicating results to key stakeholders; and convincing decision makers of their results. Hugo Bowne-Anderson, Harvard Business Review, 2018
In short: most of the daily work is getting hold of data, cleaning it and communicating the results – not the modelling that takes up most of the room in courses like this one.
But how do you find data scientists? Whenever someone asks that question, I refer them back to a more fundamental question: what makes a good data scientist? Here is what I look for: • Technical expertise: the best data scientists typically have deep expertise in some scientific discipline. • Curiosity: a desire to go beneath the surface and discover and distill a problem down into a very clear set of hypotheses that can be tested. • Storytelling: the ability to use data to tell a story and to be able to communicate it effectively. • Cleverness: the ability to look at a problem in different, creative ways. All the top data scientists share an innate sense of curiosity. Their curiosity is broad, and extends well beyond their day-to-day activities. They are interested in understanding many different areas of the company, business, industry, and technology. As a result, they are often able to bring disparate areas together in a novel way. For example, I’ve seen data scientists look at sales processes and realize that by using data in new ways they can make the sales team far more efficient. I’ve seen data scientists apply novel DNA sequencing techniques to find patterns of fraud. What unifies all these people? They all have strong technical backgrounds. Most have advanced degrees (although I’ve worked with several outstanding data scientists who haven’t graduated from college). But the real unifying thread is that all have had to work with a tremendous amount of data before starting to work on the “real” problem DJ Patil: Building Data Science Teams (2011), What Makes a Data Scientist? (p.11ff)
What Patil describes, then, is how to recognise a good data scientist: by depth in some discipline, and above all by the curiosity to keep taking a problem apart until testable hypotheses fall out of it.
A large part of a data scientist’s work is preparing data – “data scrubbing”. A good deal of classical programming craft goes into it: regular expressions, say, and a knowledge of the industry standards for data types, along with the ways practice departs from them. The list is surprisingly concrete: time and date formats including time zones and daylight saving changes, GIS formats for anything spatial, country codes (of which there are several competing systems), Unicode and the encodings it was meant to replace, and the usual departures from the CSV standard – separators, quotation marks, line breaks in the middle of a field. The craft of it has a chapter of its own in this book, Data cleaning.
Three more things it needs are taught in no lecture: patience, practice, and domain knowledge of the field of application. No data format tells you whether a blood pressure reading of 400 is a measurement error or an age of 0 a missing value – only someone who knows the field can, or someone who asks a person who does. In machine learning too, deep learning included, taking care of the training data buys considerably better results.
Further reading
A career in data science
Robinson and Nolis: Build a Career in Data Science
There is also an hour-long podcast with the authors.
State of Data Science 2021
An hour-long podcast: State of Data Science in 2021 with Stan Seibert
State of Data Science 2024
A blog post from the IDE maker JetBrains: State of Data Science in 2024: 6 Key Data Science Trends
An interesting contrast is a 2010 article by Mike Loukides of O’Reilly, What is data science?. You can see at once that the tools and software packages are in flux, and that some of what looked most exciting in 2010 has already been forgotten. But you can also see that data science is not a passing hype that will soon blow over, but a global trend more than ten years in the making, and that Conway’s three circles from the section A colourful mix still describe it well. Labels like “data mining”, “big data” and perhaps “data science” too may lose their meaning over time; what is beyond doubt is that statistical methods and machine learning will play a growing role in computer science and in society for a long while yet.
What comes next
Before we work with data, we need a precise language for chance and uncertainty. The next chapter supplies it: probability spaces, events, random variables. It contains two digressions on the measure problem, meant as background and safely skipped on a first reading; the formalism we actually use throughout the course starts at the section Formalism.
- Reinhart, C. M., & Rogoff, K. S. (2010). Growth in a Time of Debt. American Economic Review, 100(2), 573–578. 10.1257/aer.100.2.573
- Herndon, T., Ash, M., & Pollin, R. (2014). Does high public debt consistently stifle economic growth? A critique of Reinhart and Rogoff. Cambridge Journal of Economics, 38(2), 257–279. 10.1093/cje/bet075